We (Sourcegraph’s Code Intelligence team) recently made Go code intelligence faster, especially on very large repositories. For example, we cut the indexing time by 95% for the huge Go AWS SDK repository, from 8 minutes to 24 seconds. Here’s how we did it.
Background: what is code intelligence?
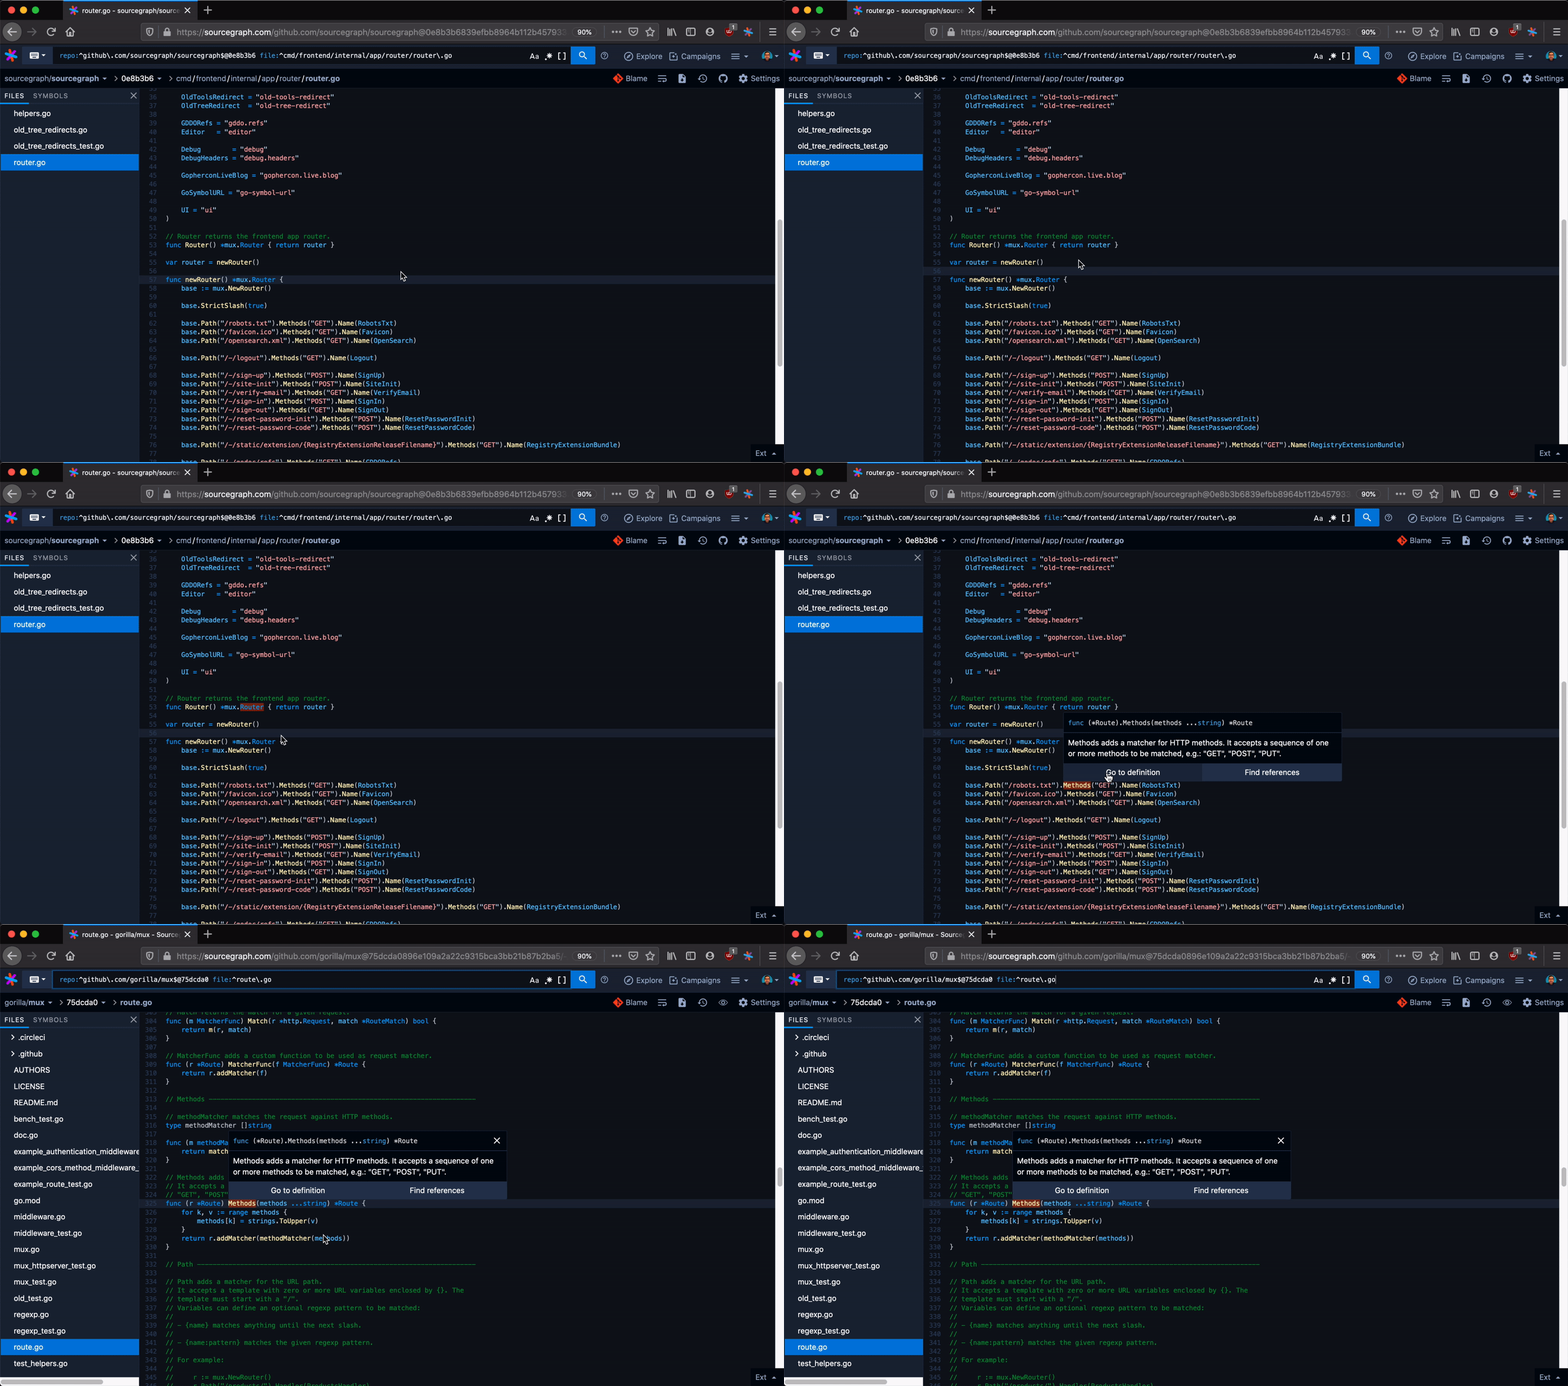
Developers use Sourcegraph for code search and navigation. When you’re navigating code on Sourcegraph, you get hovers, definitions, and references to help you along the way. They’re fast and cross-repository, can work on any branch or commit, and can be precise (with LSIF set up in CI).

The problem: really big monorepos
Sourcegraph is used by organizations all over the “manyrepo”-vs.-monorepo spectrum:
- Some organizations have many small- or medium-sized repositories (“manyrepos”). For us, that’s easy. Small repositories are fast to index, even with an LSIF indexer that performs poorly as code size grows.
- Other organizations have a few very large repositories (monorepos with 10+ GB checkouts). That’s harder, but we’ve made great strides with the recent 1.0 release of lsif-go.
Our recent optimizations focused on the very large monorepos.
Time to Intelligence (TTI)
To track indexing performance, we use an important internal key metric called Time To Intelligence (TTI), which covers the time it takes to:
- Push a new commit to a branch on your repository
- Trigger a CI job to index the code of that commit
- Upload the resulting index to your Sourcegraph instance
- Process the uploaded index
- Use the processed index to provide up-to-date code intelligence
So, after the improvements discussed here, how well do we index Go code at scale? We cut the time to index by 95%.
- Previously, it took nearly 8 minutes to index the Go AWS SDK; it now takes only 24 seconds.
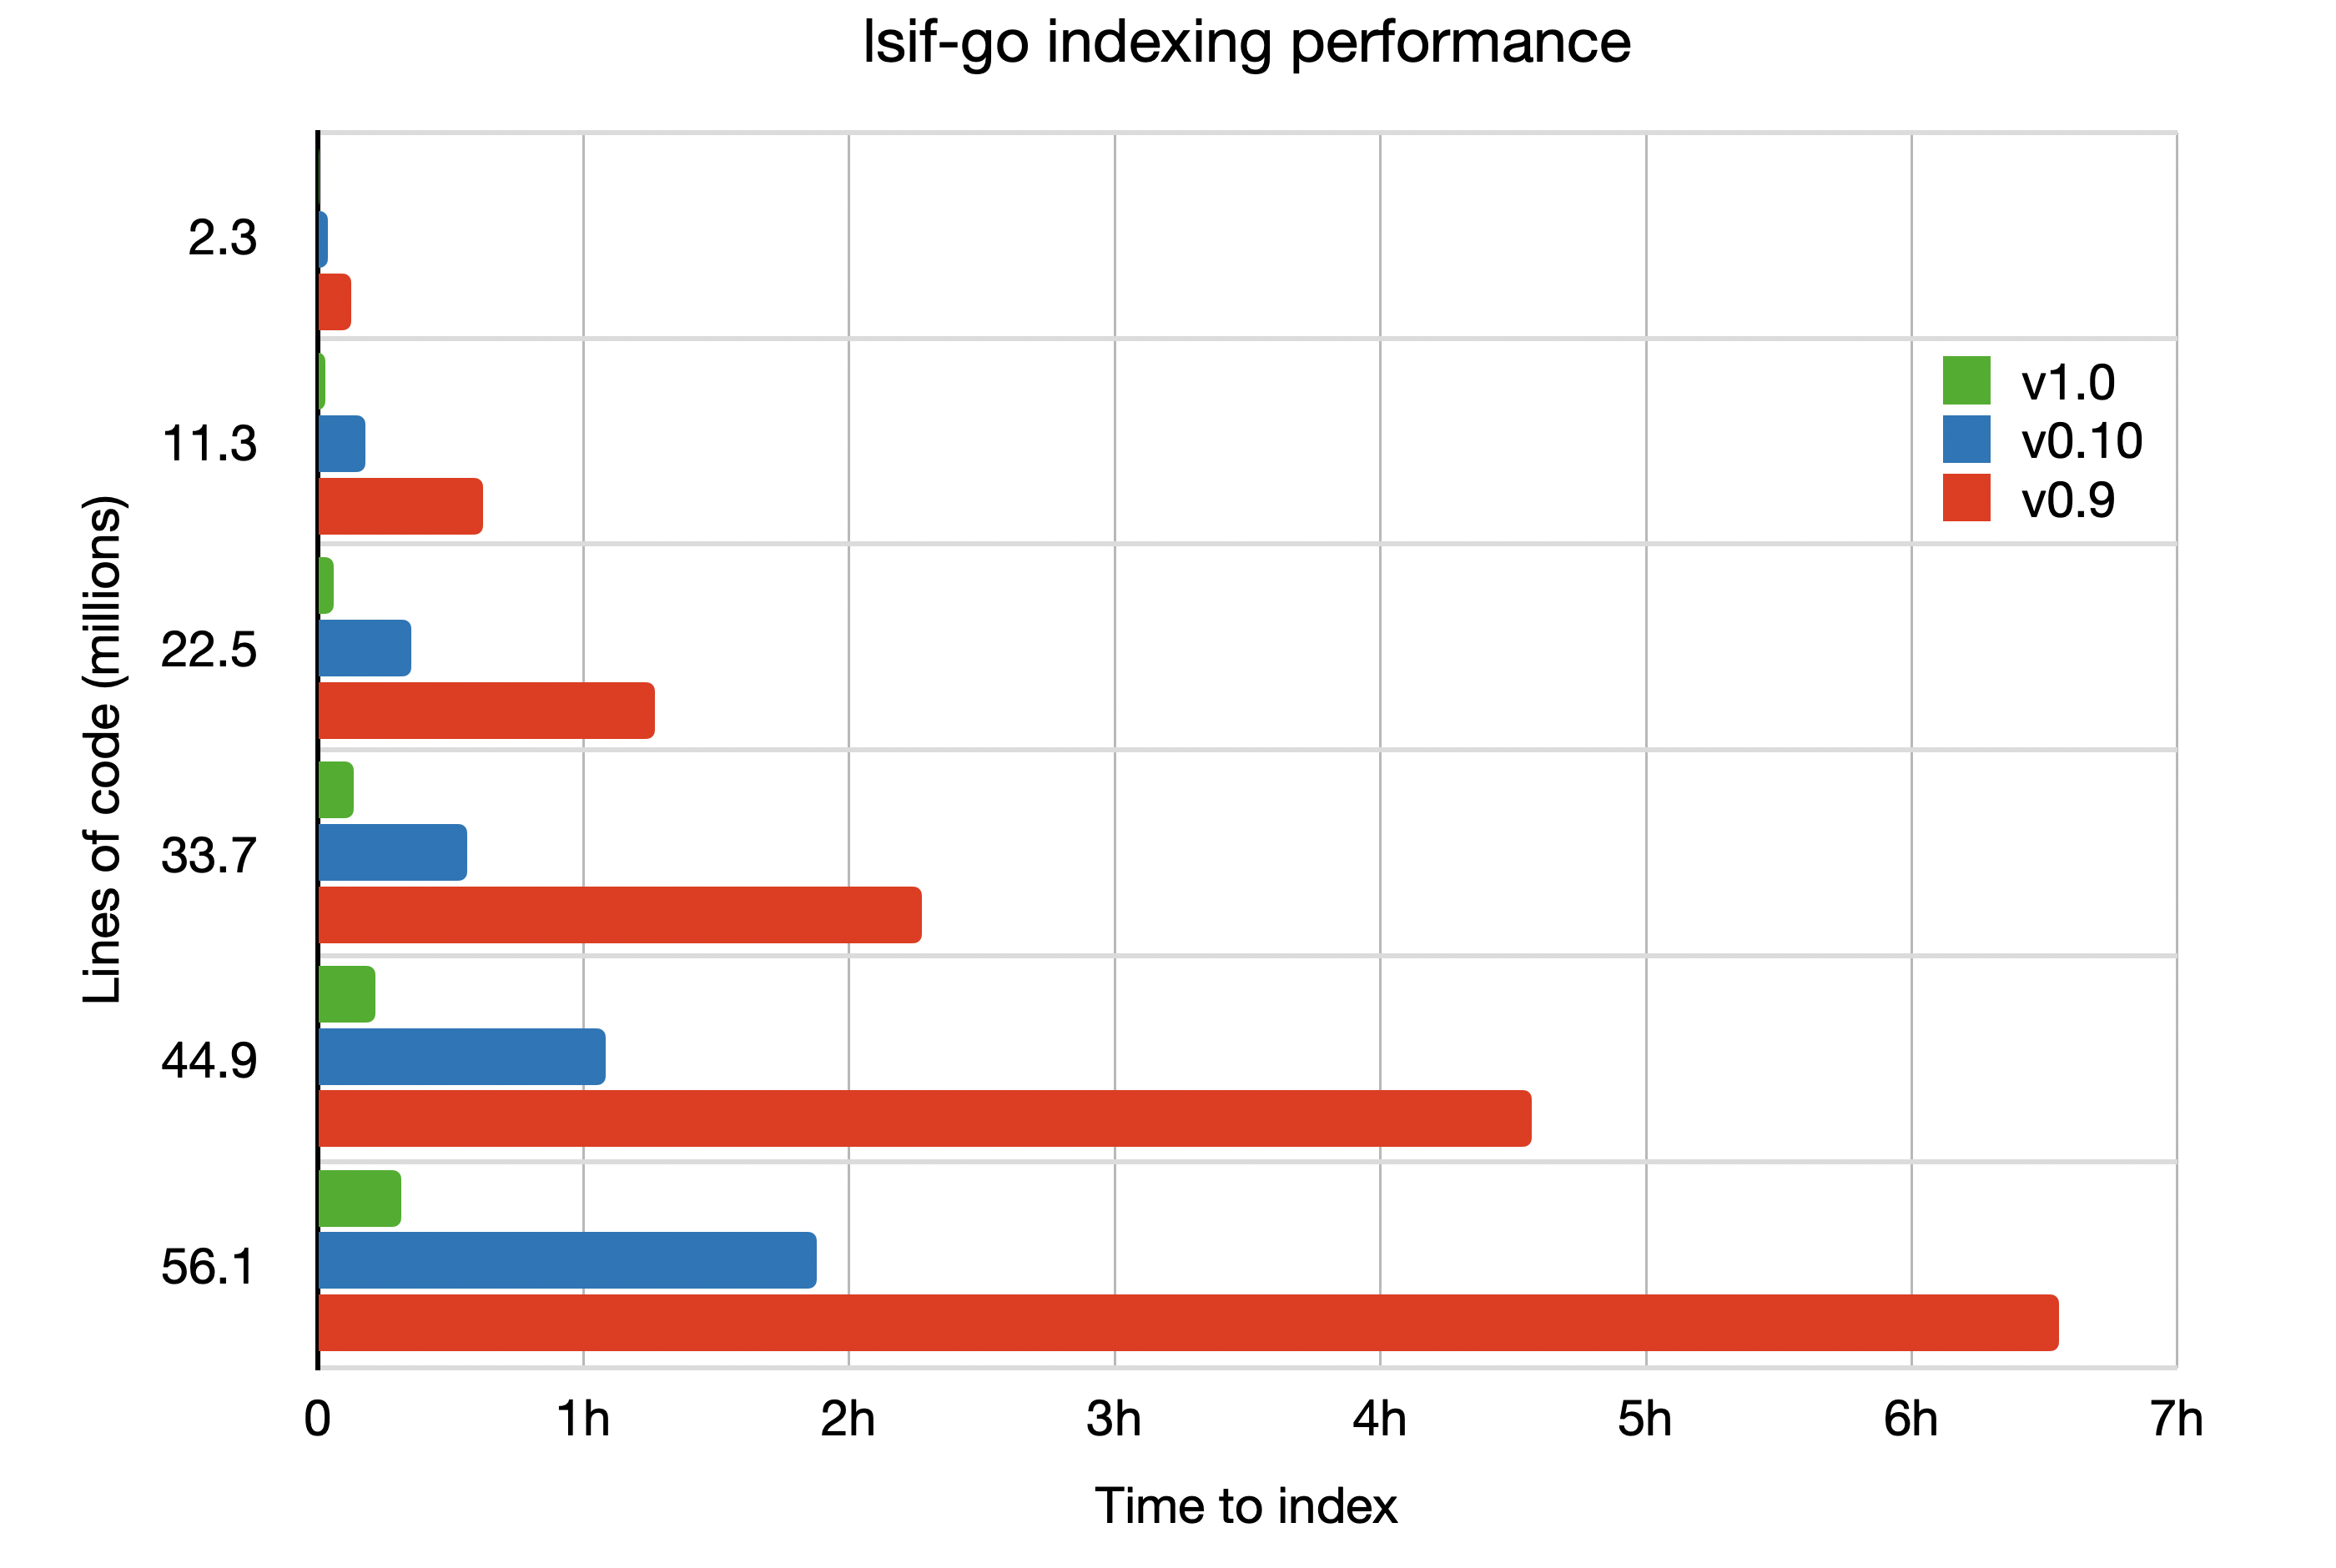
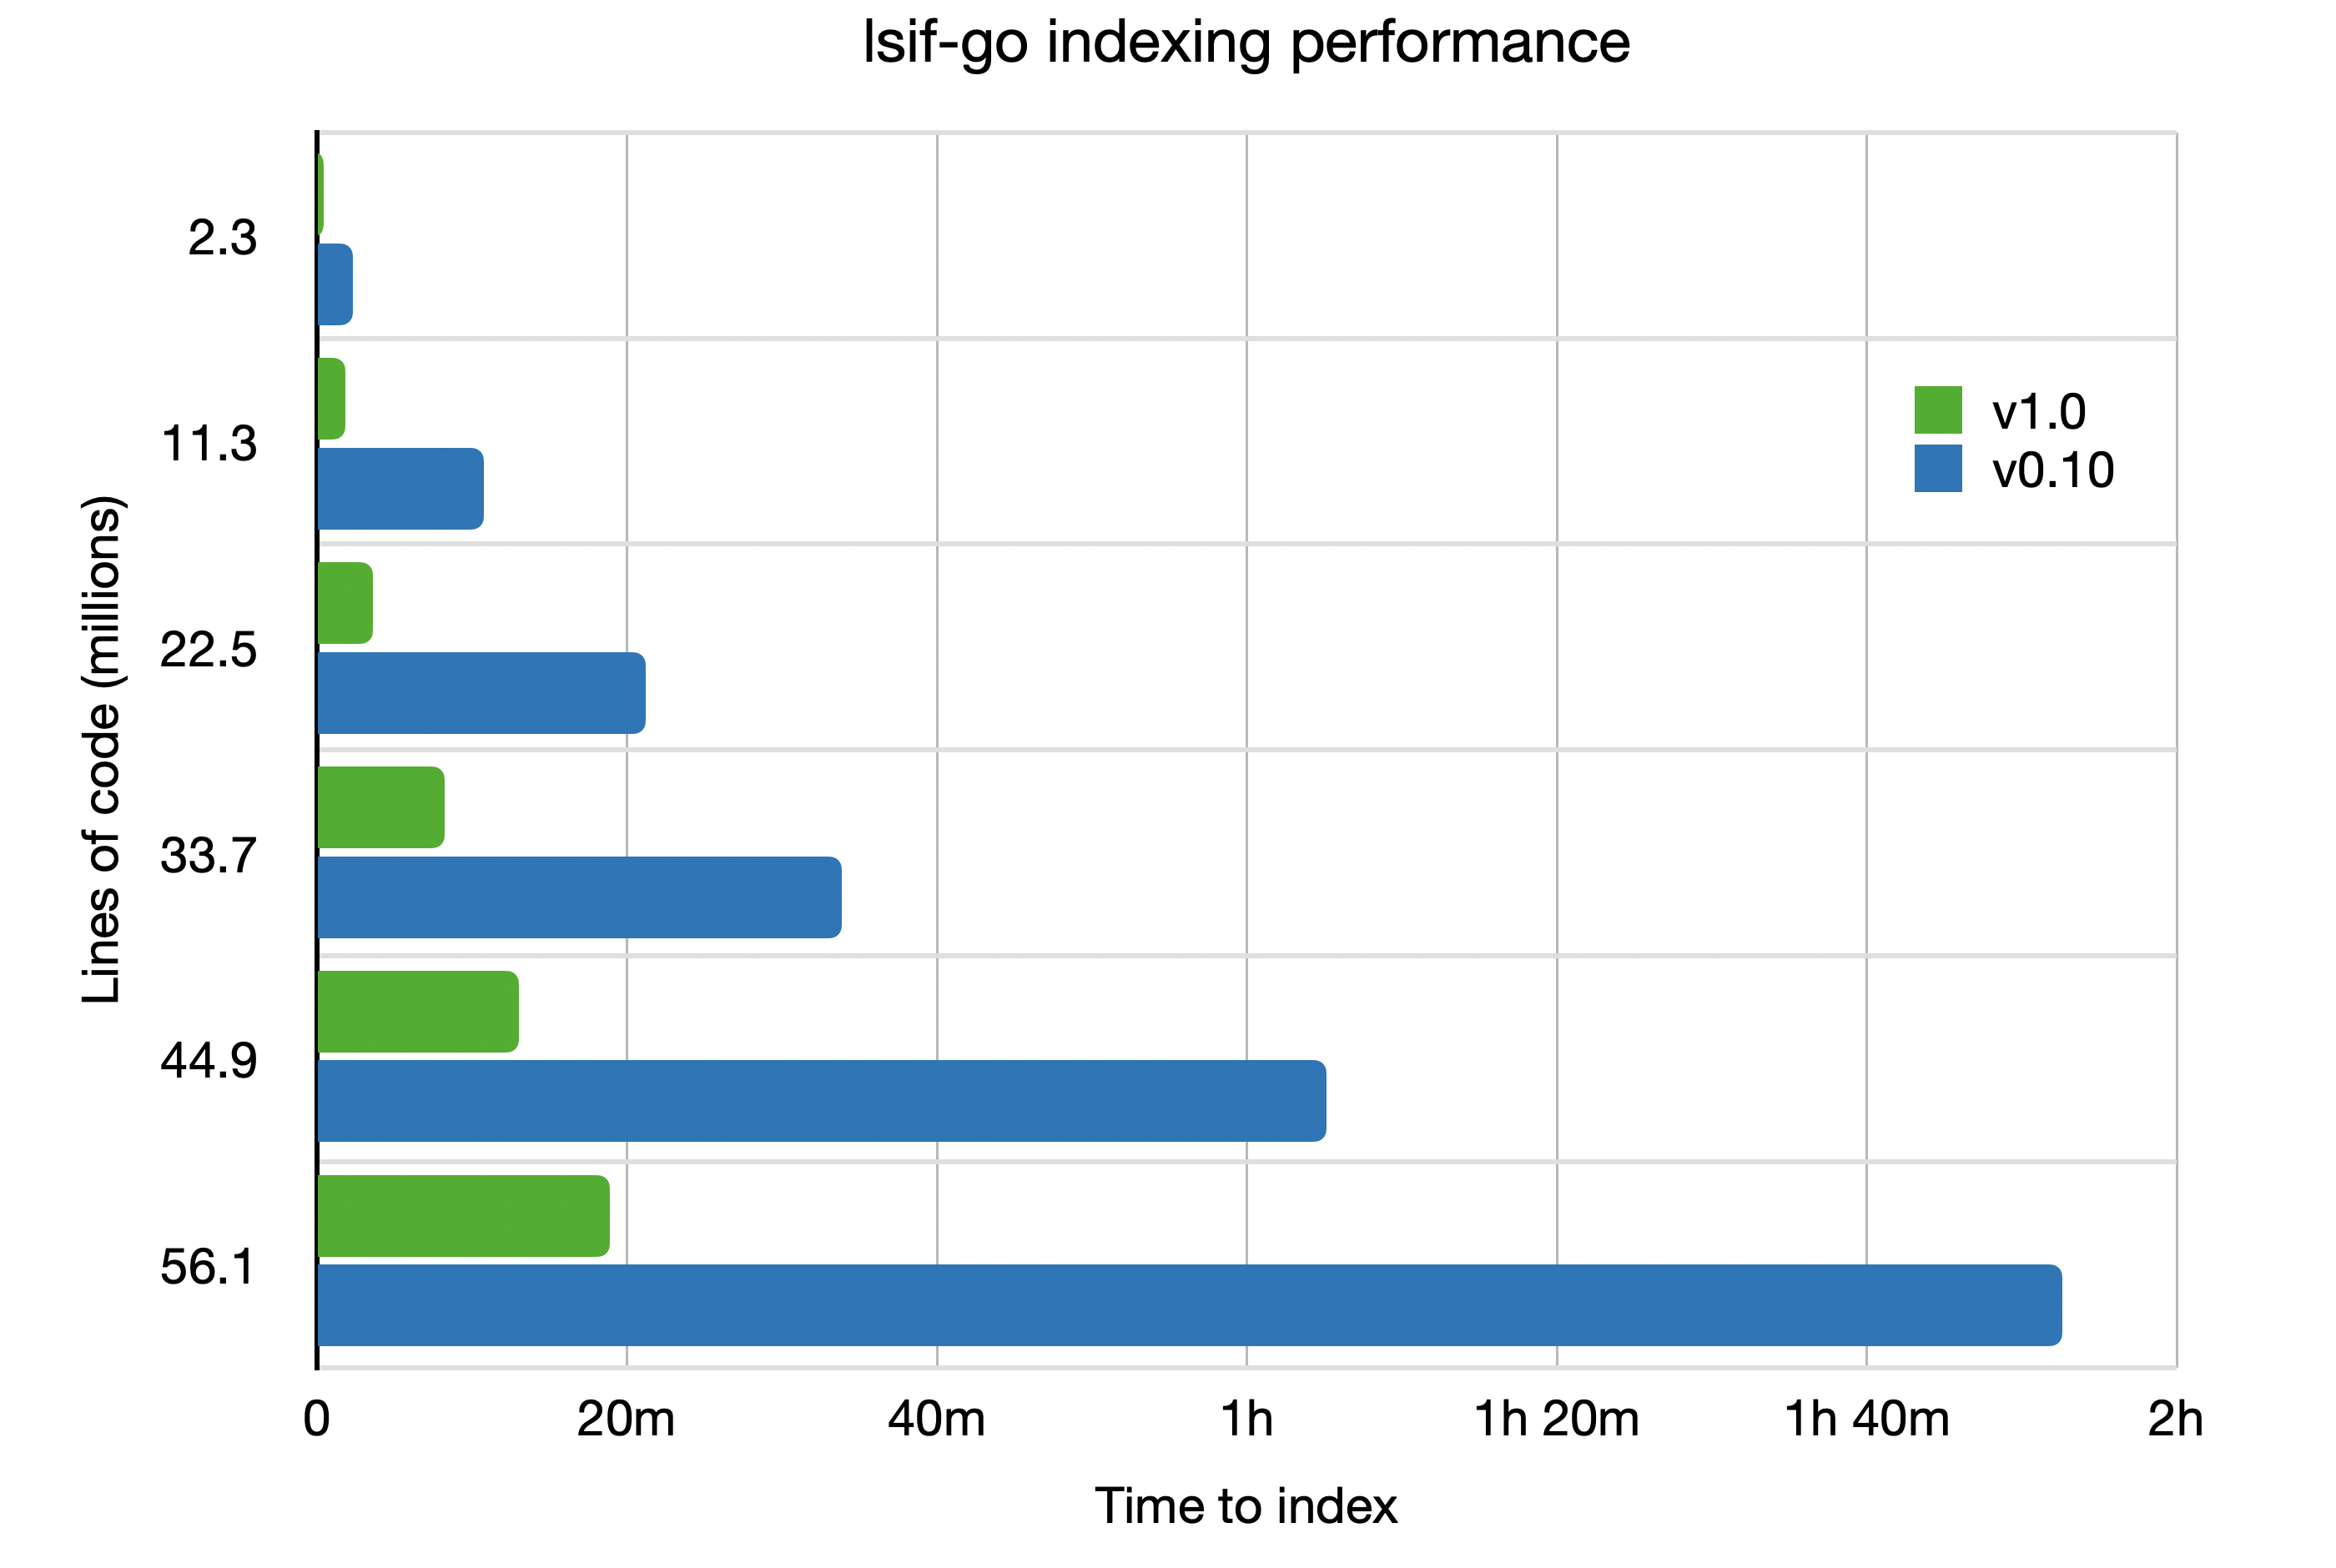
- Previously, it took nearly 7 hours to index 56 million lines of code; it now takes under 20 minutes.
Indexing speed is so important for code bases undergoing constant change. Stale, hours-old code intelligence on a monorepo at scale is about as useful as using a map of Pangea to find your way home. This is why the code intelligence team is dedicated to increasing the efficiency of every part of the stack to make sure your map of the code is always accurate.
How we optimized it
A language indexer tool is conceptually simple. It reads source code, constructs an in-memory representation of the program structure, resolves symbol names, then generates a JSON-encoded graph representation of those symbols according to the LSIF specification. Go provides tooling to parse and analyze Go source code in the standard library, leaving only the last stage for us to optimize.
Here’s how we did it.
Reduce repeated work
We think the major inefficiency of the previous version of lsif-go is best illustrated by a likely familiar, but incredibly relevant, story by Joel Spolsky about a simple worker named Shlemiel.
Shlemiel gets a job as a street painter, painting the dotted lines down the middle of the road. On the first day he takes a can of paint out to the road and finishes 300 yards of the road. “That’s pretty good!” says his boss, “you’re a fast worker!” and pays him a kopeck.
The next day Shlemiel only gets 150 yards done. “Well, that’s not nearly as good as yesterday, but you’re still a fast worker. 150 yards is respectable,” and pays him a kopeck.
The next day Shlemiel paints 30 yards of the road. “Only 30!” shouts his boss. “That’s unacceptable! On the first day you did ten times that much work! What’s going on?”
“I can’t help it,” says Shlemiel. “Every day I get farther and farther away from the paint can!”
Shlemiel and lsif-go both spent a lot of time needlessly re-executing the same operations in a way that did not help progress the task. Because an operation of non-constant cost was snuck into the lower levels of the process - into a method that was itself called a non-constant number of times - they both found themselves in a process that is accidentally quadratic.
As part of indexing, we extract the docstring attached to each symbol. In the comment extraction process is this innocuous-looking line of code that finds the closest comment attached to an identifier in the AST. The findComments function containing this line of code is actually called once on every identifier being indexed. This function is called for every type definition, every field, every function, every parameter, every local variable, and every type. Every identifier causes another traversal of the tree. Again and again, lsif-go would trace the same set of edges only find itself at a node on a path only slightly different from a previous traversal.
The following shows a very reduced Go AST for the EKS API from the Go AWS SDK (click to enlarge). Here we’re going to concentrate on the definition of the struct CreateClusterInput.


This struct contains 9 fields, meaning that there are 18 identifiers within the struct body: one for the field name and one for the field type. To find each of these nodes, the same three edges (File to GenDecl, GenDecl to TypeSpec, TypeSpec to FieldList) need to be traversed. In addition, this file contains definitions for 94 constants, 76 other struct types, 510 methods, and 21 functions. Each traversal needs to exclude these non-relevant subtrees when searching for a particular node, which also costs a non-negligible amount of time. Walking the same tree for a file with tens or hundreds of thousands of identifiers can really put a dent in the indexer’s throughput.
The solution we implemented instead performs a single walk of the AST of each file and caches the comments attached to each identifier node along the way. Then each node can simply look up its own comment in a shared, pre-populated cache during the relevant indexing step. This change cut indexing time of the Go AWS SDK by 4x.
It turns out that lsif-go was still traversing syntax trees multiple times in order to generate additional data for each symbol: its moniker. A moniker is a unique name (within the same index) for a definition and is used link symbols together across repository boundaries. For example, keeping the spirit of the examples above:
github.com/aws/aws-sdk-go/service/eks:CreateClusterInput.ResourcesVpcConfig
These AST traversals were also easy enough to optimize. While performing the walk of the AST to cache comments attached to nodes, we also keep track of the qualified names on the path down to a node (names of types containing fields, receiver types attached to functions) and cache those.
Now, we’ve greatly reduced the number of AST traversals that we perform, but that doesn’t mean that the traversals we’re still doing are efficient. When we traverse an AST, we only store the comments and monikers for nodes that we think define a symbol. Symbols that are not a definition will use the hover text and moniker of the symbol they reference. However, when looking at each node to determine if we cared about its hover text or moniker, we were looking at too much information.
One of the inputs of the traversal is an ordered list of token positions for each definition in the file. When a node is visited, we check to see if the node encloses a position in the list. If it doesn’t, the subtree can be skipped. If it does, then the node’s children should be visited as the node’s subtree contains a definition. If a node’s position equals a position in the list, then the node itself is a definition and a hover text and moniker entry should be set for that node.
Because the list of positions are ordered, we can use binary search to efficiently determine which of these three conditions are true for a node. But efficient does not equate to most efficient. Each layer of the tree received the same list of positions, meaning that the binary search operation for every node had the same cost.
It is much more efficient to instead pass along only the positions which can match a subtree. This change means that the binary search for a node decreases as its depth increases: the leaves of the tree have to search a much smaller list. Because the number of nodes in the tree (generally) increases with depth, this cost savings is compounded.
Batch what you can
An LSIF indexer is a tool that spits out an index file. The index file is generally larger than the input source code due to making the implicit definition and reference relationships explicit. It stands to reason that the performance of the indexer will eventually be dependent on the performance of formatting the output and writing to disk.
The LSIF index file is formatted as sequence of newline-separated JSON elements. These elements are generally pretty small with the exception of hover content vertices and contains edges adjacent to large documents. From a dump of 14 million lines, the median line contained only 91 characters (a line with 48 characters being the smallest).
Unfortunately, we were writing each line to an unbuffered file. Without a buffer, writing each element requires a syscsall to commit a small amount of data to the target file. With a buffer, the writes are batched so that 4096 characters are written to disk at a time. This reduces the number of syscalls, and therefore number of userland/kernel context switches, by 98%.
This change significantly improved performance.
Parallelize where possible
The implementation of the indexer has historically been single-threaded for simplicity.

Sourcegraph is often deployed onto nodes with many CPUs, but our indexer was only able to use one at a time. We’ve realized what a waste the single-threaded design was after one of our enterprise customers showed us lsif-go consuming 100% of one core, and 0% of the other 95 cores. There’s no way we’re going to miss the opportunity to see all 96 of those cores light up the next time we chat. So we made everything that is able to run at the same time run at the same time. Unfortunately, parallelizing workloads in general is not a trivial task.
Shared state must be protected from concurrent access and mutation. We did this by introducing a mutex around each shared map and slice that can be read from and written to concurrently. We use double-checked locking where exclusive access to the datastructure for writing is required:
| |
This pattern first acquires a cheap read lock on mutex and checks the likely condition that the data has already been cached in the shared map m. If the value exists, it can be returned. Otherwise, a value needs to be generated and written to the shared map for later readers. In order to handle the race condition between releasing the read lock and acquiring the write lock, we check for the value in the map again after exclusive access has been acquired.
Each shared datastructure has its own mutex so that contention from one resource does not bleed into a less-contended resource. However, it’s easy to take this pattern too far. One of our resources is a two-layered hierarchical map from documents to ranges, then ranges to range data. The first layer is not mutated, but the second layer is. Go’s RWMutex struct has three uint32 fields and three int32 fields, meaning that each mutex takes 192 bytes. If we were to give each inner map its own mutex, then our memory usage would blow up fast. Indexing the Go AWS SDK would require an additional 2.7G of memory for these mutexes alone.
Instead, we can protect the inner map with a striped mutex. A striped mutex is basically an array of shared mutexes, where a resource r is locked if the mutex at index hash(r) is locked (modulo the configured number of mutexes). This is a good middle-ground between having one mutex for a highly contended resource, and having n distinct mutexes for a map with n keys.
Work must be scheduled around data dependencies. Previously, lsif-go was set up as a simple pipeline for readability. Some (but not all) of these pipeline steps are a prerequisite for some future step. For example, we assume that our map of definitions is already populated by the time we start to index references.
Due to such data dependencies, it would be an obviously incorrect solution to run all of the pipeline steps in parallel. Our solution is to parallelize the workload in distinct steps (first index all definitions, then index all references), where each step can rely on data calculated by the previous step which was parallelized individually.
Alternative solutions here require pushing back tasks whose dependencies have not yet been met, pre-determining a dependency graph, or recursively submitting duplicate work to the queue. Each of these solutions have a down side and decrease code clarity.
The right level of work must be chosen for parallelization. You can’t throw work into a parallel executor and guarantee that your program runs faster. In fact, the first few attempts at parallelizing lsif-go weren’t fruitful because we tried to index each file in parallel rather than each package. The cost of indexing a single file was low enough that the overhead of setting up the goroutines and queueing the work negated any benefit of executing the work in multiple cores.
The cost of indexing an entire package is high enough that there is obvious, tangible benefit of indexing multiple packages in different cores. This benefit far outweighs the any of the setup and queueing overhead.


In the current version of lsif-go, all writes to the file are synchronized by a single goroutine controlling the output buffer. This ensures that for any single goroutine emitting elements, the order of the elements they emit will hit disk in the same order. This is important as LSIF requires that edges refer only to a vertex that has already been indexed.
Each non-trivial task is broken into package-level work, queued into a channel, and then distributed over a number of goroutines (that scales depending on the number of physical cores on the indexing machine). A task finishes once the entire input channel has been consumed and each worker goroutine has exited. Each task makes a fresh set of goroutines.
Reviewing results
The following chart show the comparison between lsif-go v0.9.0 (the un-optimized, previous release), v0.10.0 (some optimizations applied here), and v1.0 (the new stable release).

Dropping the un-optimized v0.9.0 release from our data set, we get the following chart with better readability for the index time required by lsif-go v1.0.

We’re still working on improving performance so every language, every codebase, and every programmer gets fast, precise code intelligence. If you thought this post was interesting or valuable, we’d appreciate it if you’d share it with others!
To read another optimization story similar to this one, see our previous discussion about optimizing the code intelligence backend, which concentrates on reducing the latency of the part of the code intelligence indexing system that receives the data emitted by LSIF indexers like lsif-go.