At Sourcegraph, we have recently decided to migrate code intelligence data that has historically been stored in thousands of SQLite databases on disk into a single Postgres instance. Long story short, we were running into some limits of writing a persistence layer over SQLite databases in a consistent way.
- We were unable to horizontally scale, as one database can only be opened by one backend at a time. We would need to implement a sharding mechanism in which data is spread out evenly across multiple machines, and requests could be routed to (one of) the backend(s) with that data.
- We also had to maintain a symmetry between rows in the database (metadata) and the files on disk (actual data). This required a janitor process to run in the background to clean up data that was orphaned on the other side. This process would be additionally complicated if we were to shard data onto multiple disks.
We noticed these problems were symptoms of accidental complexity within our system rather than essential complexity inherent in our problem domain. Moving this data into Postgres allowed us to reduce some operational concerns by unifying data access and allowed us to solve the problems we’re actually getting paid to solve.
See this related article how the architecture of the code intelligence backend services have evolved over the last year. This change is just a small aside in a much larger journey – one that is just getting started.
Migrating
The change wasn’t terribly complex, but did involve several steps to ensure that we didn’t fail requests unnecessarily by moving the data source out from under the server.
- Update the janitor process to understand Postgres as a data source, so that a missing file does not imply missing data. This is necessary so that we do not delete what the janitor sees as orphaned metadata for data that exists in Postgres but not on disk. (#14468)
- Update readers of SQLite to first read from Postgres, then fall back to the SQLite file on disk (if one exists). (#13924)
- Introduce a new background process that opens SQLite files on disk and writes the same data into Postgres. (#13932)
- Update writes to target Postgres instead of a SQLite database. (#13946)
Around this time, we had nearly a terabyte worth of SQLite files on disk that needed to be migrated. During a feasibility study a few weeks prior, we found that the migration would take a bit over twelve hours when run on a moderately-sized GCP compute node – not something that we could comfortably monitor within a single engineering shift.
I tend to rely heavily on experimentation and refactoring in order to develop a solid understanding of what I’m actually trying to produce. For most of my day-job work, I will write a feature to completion on a private experimental branch, then cut the changes up into smaller, more digestible chunks for peer review. I don’t know how common this workflow is, but it works for me personally and allows me to hit a productivity and confidence sweet spot for work that necessarily spans multiple pull requests.
This workflow is generally non-problematic.
Troubleshooting
After merging the PRs, I kept an eye on the behavior of the production instance for a while. I ensured that data I knew was stored in Postgres was readable. I ensured that data I knew was still stored (only) on disk was still readable. I ensured that the data on disk was being migrated properly, and that once the migration has completed the same data was still accessible in a way completely transparent to the user. Looks good, feels good – off to bed.
The morning comes and I am greeted with an 8am Slack message in the code intelligence channel: I can’t get code intelligence working in sourcegraph/sourcegraph on Sourcegraph.com. I just see a spinner. Does this have anything to do with the above mentioned migration?
Of course it does. And it’s difficult to nail down exactly how it has to do with the migration due to a number of factors in play:
- We were running Postgres via CloudSQL, where as we’ve historically been running Postgres in a pod in our Kubernetes cluster. This lead me to believe that the small number of knobs that the managed solution exposes were ill-tuned for this write-heavy workload.
- We were running background migrations which lead me to believe that it was causing issues on either the service that was interacting with Postgres, or we were hammering Postgres too quickly with bulk inserts. Something was causing the service’s CPU utilization to exceed 90%.
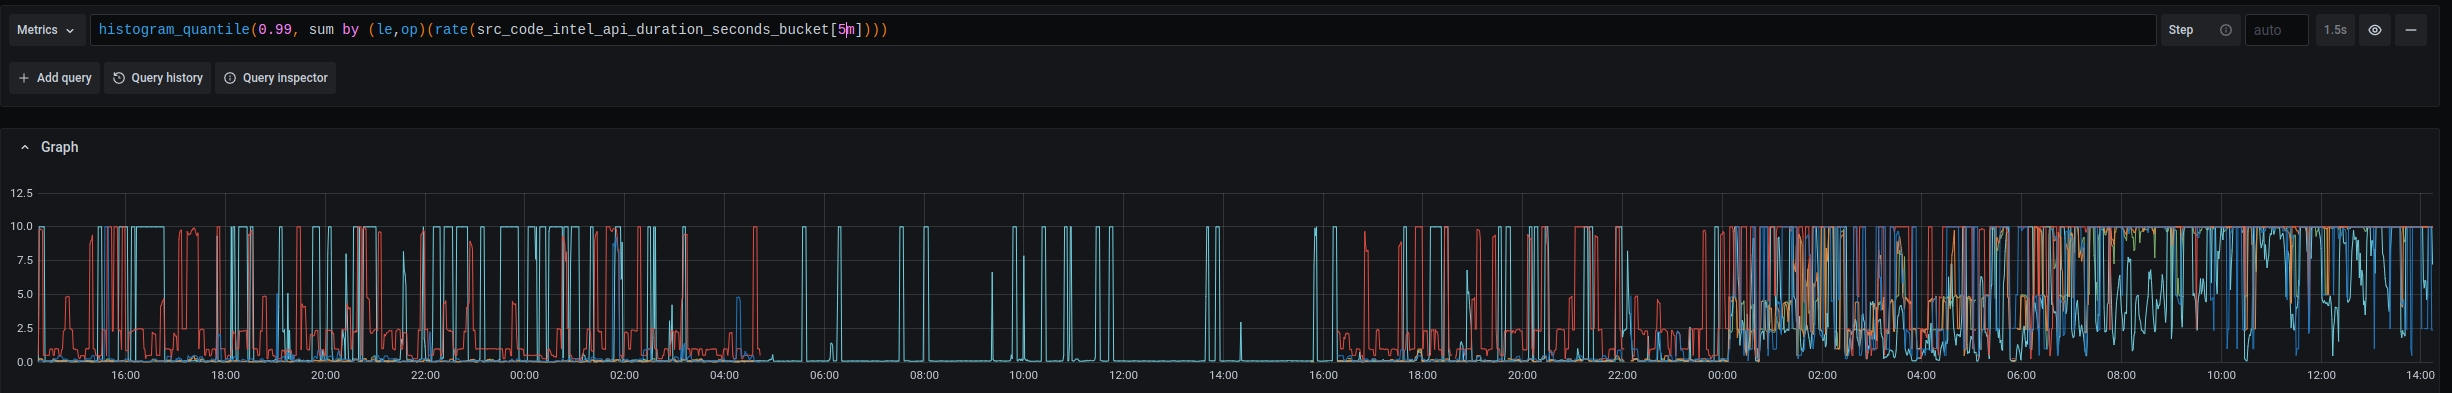
- All code intelligence queries were timing out after ten seconds from some timeout parameter configured on some layer of the stack (CloudSQL, cloudsql-proxy, our sql library, our the client disconnecting due to a timeout).
To make matters worse, there was not a clear path to revert these changes to stabilize the production environment. We have been writing only to Postgres from the worker process, so reverting the stack to only read data from SQLite again would have caused us to lose the last 12 hours or so of code intelligence updates. The steady progression of disk usage on the database machine is mostly due to migrations, but a non-trivial amount of that data would have been user uploads from a continuous integration system, or uploads from auto-indexed repositories.
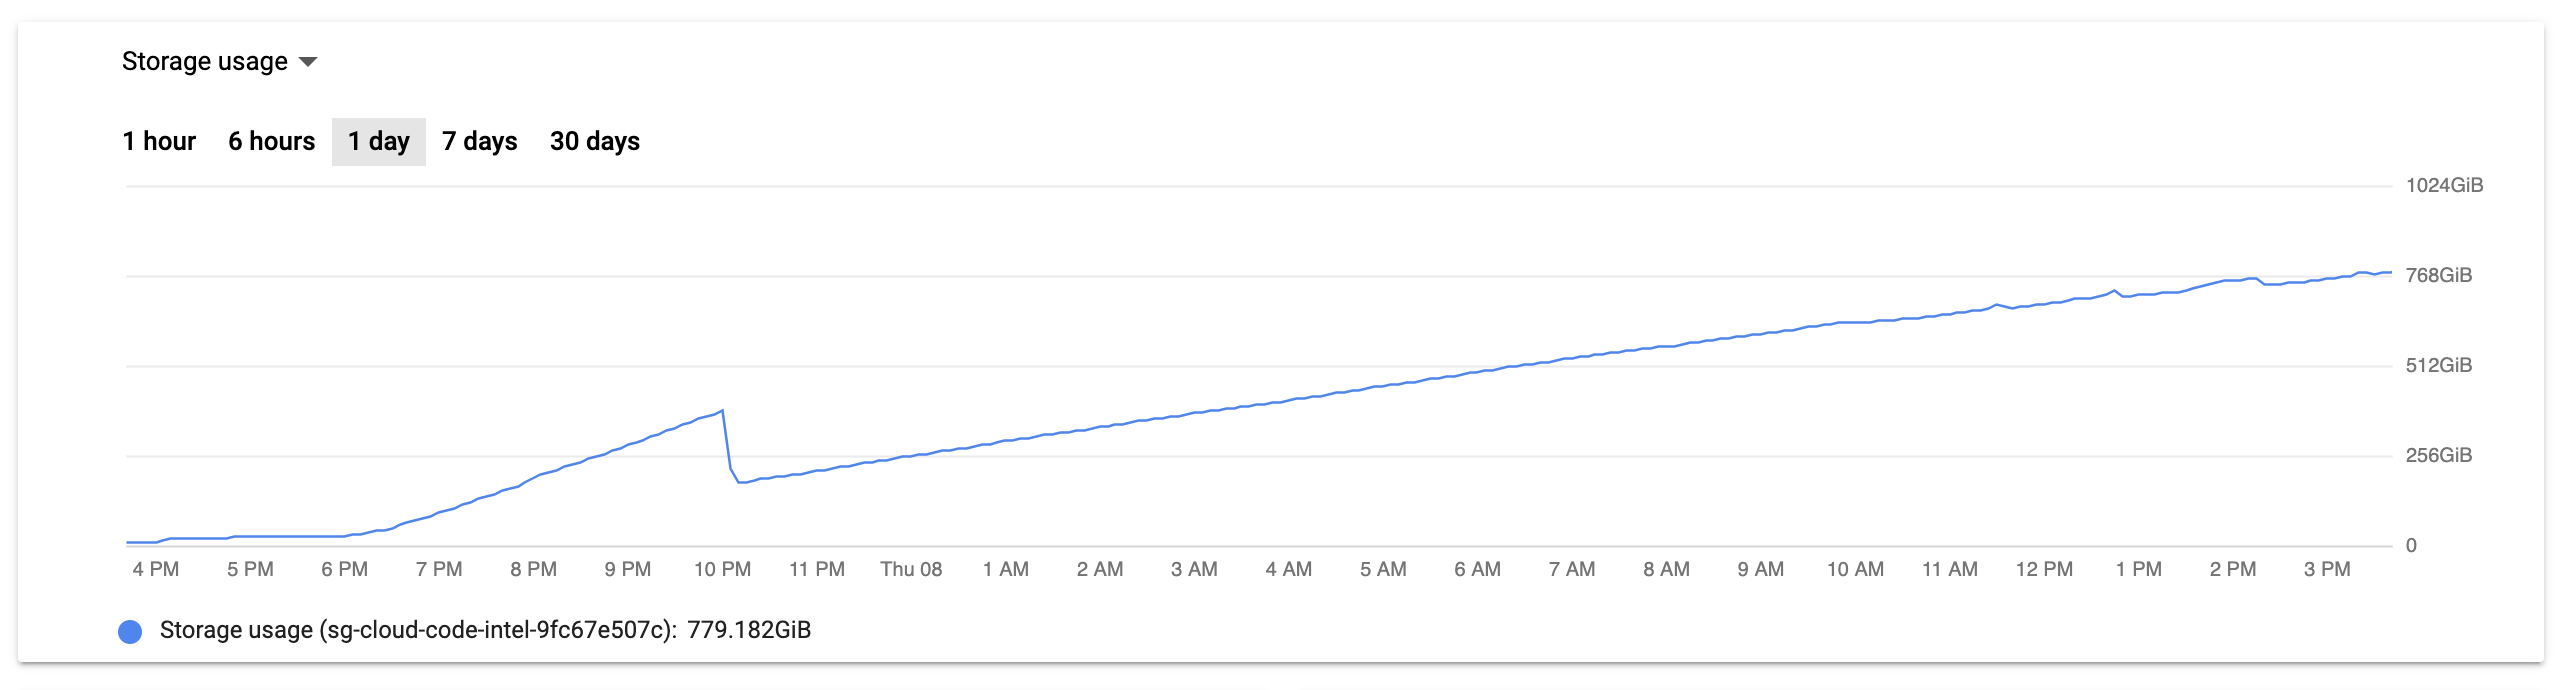
Looking at the other graph for the CloudSQL instance, we clearly had a problem with the database server itself. Between 6PM the night before to 10AM the same morning, CPU utilization was regularly spiking above 80%, nearly zero egress bytes, and increased but nearly straight line of both active connections and transactions.
This graphs clearly identify the problem as being squarely in the inefficient-query bug space, but it still it took about two hours of chasing red herrings in a panicked state to find the root cause.
I turns out that I had inadvertently created the new tables without any indexes.
In my experimental branch, I was toying with the idea of using postgres_fdw to shard data across multiple code intelligence databases. We decided to punt on this feature for the time being, at which point I copied the simple version of the schema without foreign partitions into a PR for review.
The feasibility study told us that the lsif_data_documents table would be 5.5 gigabyte table with a 261 gigabyte of TOAST. Without any indexes, this query was performing a parallel sequential scan over a 5.5 gigabyte table each request – and very few code intelligence requests are simple enough to be fulfilled by a single database round-trip.
| |
Repairing
The solution was a trivial as the initial mistake: just add indexes. This was easy enough to do, although we had to do it by hand. Our migrations run in our frontend API pods, blocking application startup until the migration has completed. Blocking production startup in order to write hundreds of gigabytes of indexes to a database was a non-starter. Our solution was to run the migration by hand in a CloudSQL shell in order to regain a responsive service, and merge a migration into the main branch that could be performed idempotently. This way, we can use concurrent index creation to avoid a full table lock, and the schema in our repository matches what is in production (a DevOps prime directive).
| |
… Oof.
Ok, so unique indexes are a no-go due to the state of the data we’ve been migrating. The big problem here is the lack of indexes, not the lack of uniqueness, so we can deal with this in steps.
| |
Alright, this worked fine. As did the index creation for the lsif_data_documents and lsif_data_result_chunks tables. Unfortunately, the lsif_data_definitions and lsif_data_references tables were a bit of a different story.
| |
Temporarily bumping the temp_file_limit from 1G to 20G allowed us to create the remaining indexes. Once this was done, everything was beyond fine – like there was never an issue at all. The resource graphs above show an immediate drop around 10AM, which is when the new indexes took effect.
I would find out later that the duplicate data in the lsif_data_metadata was not actually due to duplicate inserts (as I had originally feared), but due to write multiplication in the parallelized bulk inserter. Easy fix. The last thing to do is to create another version of the indexes with the uniqueness property and drop the temporary one we made to staunch the bleeding.
Lessons Learned
Don’t hire me as a DBA.